
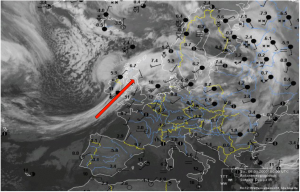
Figure 1. IR satellite image from METEOSAT at 8th January 2005. Clouds are in white and the red arrow shows the direction of the air flow in the WCB.
The advent of satellite imagery opened our eyes to many unseen aspects of the airflow in the atmosphere which had been invisible to most scientific instruments. It gave us the possibility to trace the transportation of moisture from tropical regions to the higher latitudes. Further, we could integrate the amount of the water vapour throughout the depth of the troposphere (lowest layer of the Earth’s atmosphere) everywhere, especially over the oceans. The latter approach proved to be an invaluable tool to discover a weather phenomenon called “atmospheric river”.
It all began with the measurements of carbon monoxide for the Air Pollution from Satellite (MAPS) project in 1990. A puzzling feature was the presence of high carbon monoxide values well removed from their sources. Newell et al. (1992) were first who used this satellite data to shed some light on the transport problem. They found corridors of vertically integrated water vapour fluxes over the ocean and used the term “tropospheric rivers” to emphasize the large amounts of water vapour being transported in the troposphere. This striking finding was further investigated by Zhu and Newell (1998) at MIT using observations from polar-orbiting satellites and research aircraft over the eastern Pacific Ocean in the winter of 1997-98. Their result showed that these filamentary features, which they called atmospheric rivers (ARs), constitute a significant fraction of the total moisture transport, and almost all the meridional (south to northward) transport atmid-latitudes.
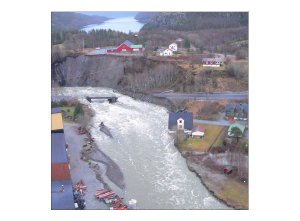
Figure 2. Flooding in Norway 14-15th september 2005.
The interest in studying ARs has increased in recent years because of their strong link to several flood events in the extratropics (latitudes beyond the tropic but not polar regions). In these regions, atmospheric large-scale low pressure systems are associated with extreme precipitation during the cold seasons. They form where cold-dry polar and warm-moist tropical air masses meet. This result in a very unstable atmosphere. The unstable atmosphere then responds by rearranging the air in the boundaries between two air masses. Consequently, warm and cold fronts are formed in pairs as the low system moves poleward. In this way, low-pressure systems transport the moist tropical air toward higher latitudes. As the cyclone moves over the ocean, it may take up additional moisture which increases the potential for intense precipitation later when it hits land. In the 1960’s, observations in the the troposphere revealed that the ascending air stream over the advancing warm front is responsible for the transport of the moisture. Carlson (1980) termed this warm and wet flow the warm conveyor belt (WCB). The IR (infra-red) image in the figure (1) displays the WCB (red arrow) and its associated cloudiness coverage over the North Atlantic.
Thanks to satellite imagery,we now have a better understanding of ARs. We know that they are narrow regions of increased moisture transport in the troposphere, having lengths several times their widths and translating throughout the troposphere. They have a transient nature which means their lifetime is short (about 1-3 days). Satellite pictures show that they are always present somewhere over the globe. They are embedded within the extratropical cyclones and are a wider part of the WCBs. In fact, circulations in the low pressure systems are the large scale driver of ARs, and WCBs are like expressways for the passage of water vapour coming from the equator.The strongest ARs, which are at around 2000-3000 kilometres long and several hundred kilometres across, carry more water than the Amazon! Therefore, an atmospheric river mega-storm could be a hugely destructive event.
However, those systems that strike the coastal area (called “land-falling ARs”) are of major interest for weather forecasters. When they encounter coastal mountains, the air which is rich in water vapour, rises up the mountain, cools, condenses and falls as intense rain or snow. Therefore, western coasts of US , UK and Norway are vulnerable to this type of weather situation. It is difficult to predict this type of precipitation in the sense that numerical models have problems with their timing and duration. Nevertheless, satellite images help us in nowcasting and very short-range forecasting of precipitation events associated with the presence of ARs.
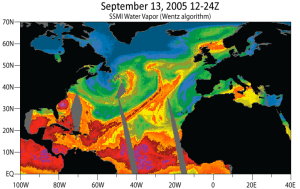
Vertically integrated water vapour over ocean at 13th September 2005. The red colour implies where the water vapour is concentrated.
Western Norway is prone to extreme weather mainly because it is located at the end of the North-Atlantic storm tracks (the regular and frequent passage of extratropical low pressure systems). An example is the extreme precipitation event on southwest coast of Norway in September 2005 (Figure 2). There is no climatological study concerning the relation between the ARs and flooding events in Norway, but a few case studies show that extreme precipitation may coincide with the presence of moisture plumes originating in the tropics. Coastal regions in Norway experience less number of ARs, compared to US and UK, because they are further from the equator. On the other hand, the high storm activity over North Atlantic can provide the conditions to increase the number of ARs. The figure (3) shows the AR system associated with the 2005 flood in western Norway. The red colour implies where the water vapour is concentrated. The narrow in-red region stretched south-west to north-eastward indicates the position of the AR.

A schematic configuration of weather systems observed during AR events hitting Norway.
It seems that the role of a large scale high pressure system over Europe is also crucial for the formation and persistence of ARs that reach Norway. The figure (4) illustrates a configuration in which the moist tropical air (green arrow) is forced toward the higher latitudes. The clockwise (red) and anticlockwise (blue) circulations induced by high and low surface pressures, respectively, push the moist air north-eastward at lower latitudes over North Atlantic. Such a pattern is observed in almost all ARs that hit the western Europe.
One of the major concerns related to the global warming is whether powerful weather systems which cause flooding will become more frequent in the 21st century. As it is always the case, the question is whether ARs will be more frequent or more intense in the future. The answer may lie in changes in the storm tracks, the atmospheric river storms, and the capability of atmosphere in holding the moisture.


Could it be that the increase in atmospheric blocking events, related to the changes in jet stream patterns, sustains ARs over longer periods of time?
It could be true. Because blocking highs result in meridional and zonal transport of moisture to higher latitudes which persists for several days. I think that “Atmospheric Rivers storms” are the main drivers. For example, when an omega-type blocking is located over Europe, mobile mid-latitude cyclones are blocked out over North Atlantic. They can force the water vapour over ocean to travel far distances. Though, the filamentary structure of the atmospheric rivers suggests that we should also consider the meso-scale processes ahead of the cyclone. By the way, we may have only one large scale or 2-3 smaller low pressure systems. Then it depends on how these systems develop and intensify.
You mention US, UK and Norway as regions that are much effected by atmospheric rivers. What about Canada (too far north?), Ireland and France? Particularly, Brittany in northern France could be a “wet spot” since it is much closer to the equator?
Air masses in ARs are rich in moisture, but it is the vertical forcing due to steep orographic rise in the coastal regions that condensates the moist air and releases precipitation. Such coastal mountain ranges are only seen in the western coast of US, UK and Norway.
Yes, but don’t forget Republic of Ireland too (not part of the UK!) – particularly the mountains of counties Cork, Galway and Kerry (reach up to 1000m, higher than any in England) – many instances of record precipitation in these locations
Also, as *Koffi et al (2013) show, efficient precipitation in high IWV situations contributed to massive Swiss floods of 2005.
*Koffi, E., Graham, E. and C. Mätzler (2013): The water vapour flux above Switzerland and its role in the August 2005 extreme precipitation and flooding. Meteorologische Zeitschrift, 22(3), pp1-14..
Several points…first, the UK has not traditionally been an AR hotspot, but activity has increased in the last few years, and expected to continue:
http://iopscience.iop.org/1748-9326/8/3/034010/article
“For each of the ARs identified in the Historical (1980–2005) and the RCP4.5 and RCP8.5 projections (2074–2099), the maximum IVT at 4° W (averaged over the lifetime of the AR) was calculated. Our results indicate that there is a projected increase in IVT in the future (see supplementary figure 2 available at stacks.iop.org/ERL/8/034010/mmedia). With an increase in radiative forcing and thus rising air temperatures, an increase in saturation vapour pressure and atmospheric moisture is expected in line with the Clausius–Clapeyron relationship. Therefore, an AR impacting Britain in the future is projected to deliver more moisture, potentially causing larger precipitation totals and associated flooding. A two-sample Kolmogorov–Smirnov test (KS test) was applied to test whether the Historical IVT distributions were different from the RCP simulations. With the exception of the GFDL-ESM2G Historical versus RCP4.5, the null hypothesis that the distributions are the same is rejected at the 0.01 significance level.”
And articles like this:
“Last winter, rain-swollen storms gave the UK a drenching it won’t soon forget: waves lapped against houses, mired cars became live-human traps, people were crushed by falling trees and drowned in boiling rivers. Lumped in with the damage caused by the summer’s also-bad floods, the blow to the country’s coffers totaled about $1.6 billion.
And that most foul year could be just the beginning of decades of flooding, according to researchers from the University of Reading and the University of Iowa. These scientists are concerned about the meteorological movers behind the UK’s recent floods: vast channels of moisture in the sky known as “atmospheric rivers” that convey great amounts of water over the globe.” http://atoc.colorado.edu/~friedrik/ATOC1050/Understandingxx/chapter16.pdf
Secondly, I was disappointed you did not take this opportunity to address the anomalous Colorado AR that we have just witnessed…yes, that was an atmo river, and yes, it had some special dynamics. I have watched the TPW maps for about 3 years now and have connected a large number of flooding events to atmospheric rivers…or glacier melt. The California ARkstorm of 1861-62 was a huge event, and the west coast does have more regular atmos that impact it, so focus on AR’s has been mostly directed at California (for example, the ‘ARkstorm disaster scenario movie’ http://www.youtube.com/watch?v=8P-N-HA9iS8 Also, Dale Cox can be found on FB at the site, ARkstorm). The name ‘ARk’ storm was born from this event, as it rained for 40 days and 40 nights, and as described to me directly by Dale Cox, the atmospheric rivers were CONSECUTIVE, which is the qualifying difference between isolated atmospheric rivers and ARkstorm events. However, as climate change wildly swings her cluebat, we find the punches landing in unexpected regions. In the case of Colorado, the Wasatch Range is on the ‘areas most likely to be impacted list,’ yet not one meteorologist called this out before the fact…if they had, yes ALL the signs were there, lives could have been saved and communities prepared a little more effectively. From the moment the report about 3 feet of hail came in, I was watching that like a hawk, and knew it was going to be bad. http://tropic.ssec.wisc.edu/real-time/mimic-tpw/global/main.html
Another example of changes in atmospheric river activity has been happening in my backyard all summer, here in the PNW. The ‘season’ for atmospheric river impacts is generally the month of November, but we have been having anomolously high humidity and storm fronts coming in that can be tied directly to unseasonal atmospheric rivers. Below I have provided a helpful link which outlines typical atmospheric river expectations:
Click to access chapter16.pdf
Also, not to be overlooked is the understanding of how our oceans have been trapping a large percentage of the planet’s heat, which gets released into the atmosphere and exacerbates tropical water vapor. So while temperatures in your backyard may not have varied ‘as expected,’ it is folly to think global warming is not happening. Most people do not have the ability to look at the big picture with all of it’s details, they just want a chart with a graph of information that does not necessarily reflect impact of all factors, for example, arctic ice sheets. It is one thing to say, HUZZAH, new growth, 60%, all is well! Entirely another to look at the sea ice THICKNESS: http://www7320.nrlssc.navy.mil/hycomARC/navo/arcticictn_nowcast_anim30d.gif and understand that that ‘new ice’ is extremely vulnerable to environmental impacts from cyclones, etc.